I live in the worst area in the UK for dating
Table of Contents
Analyzing and plotting the 2021 Census data instead of, you know, going outside.
Introduction
Where are all the women at?
I live in Cambridge and it's okay. There are infrastructure and housing problems but where aren't there these days? It's a university city too. Sure, they only started giving degrees to women in 1948 but, 76 years on, you'd think the gender ratio would have balanced out. And anyway, undergraduate students aren't in my dateable range any more and the population that is isn't necessarily just the student population but older.
But I started having this suspicion. Things were just a bit too off. On the streets, on dating apps, in grocery stores. I had to know.
The government had to know too. That's why they do a Census every ten years, with the most recent one being in 2021. It collects plenty of data, not just sex but also demographics, occupation, housing, travel, education, health etc, with over a hundred variables, broken down by local authority, middle layer super output areas and output areas (basically, a block).
But the built-in visualizers, like the one on the Office for National Statistics' website, don't allow you to visualize more than one variable or condition the value on another variable. So, I could only get the gender ratio in my local authority and not the gender ratio in a certain age range. And that 49.9% female-to-male ratio that I saw in the data browser sounded too clean. Too convenient.
It was time to download the data and figure it out myself. How bad was the city of Cambridge really in terms of the gender ratio?
I had no idea.
Acquiring the data
Step one, go to the ONS's website and get the TS009 dataset. There's also a more granular version, RM200, that goes down to the individual output area, but that's way too granular (too noisy and if need be, I can always travel around beyond my street).
%
=
=
Calculating the stats
Step two, draw the rest of the owl.
=
=
We're interested in women aged 25-30. We're also interested in our competition, men aged 25-30 (well, that might be different for men than for women but let's do it this way in the name of symmetry).
This obviously has a bunch of other assumptions: that all these people are single or at least equally single and equally monogamous and/or equally homosexual. But it's a start.
Now, let's get our counts and the gender ratio:
return
=
=
=
Plotting the stats
So, let's plot the top local authorities by gender ratio.
=
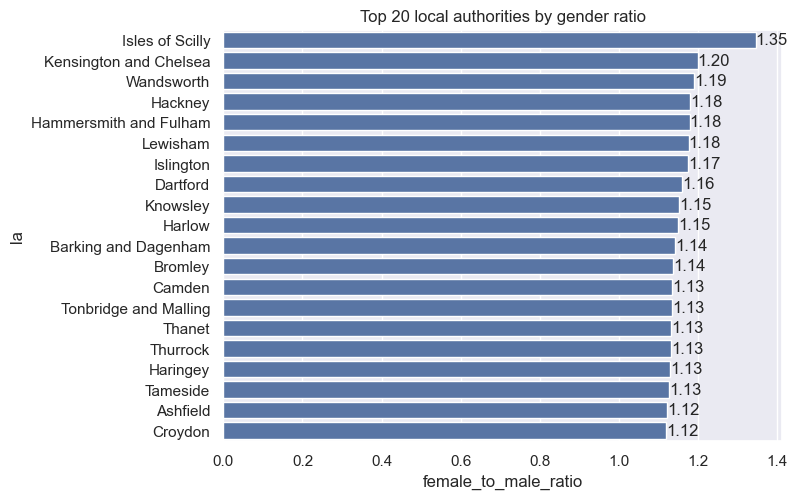
Sounds reasonable. A lot of boroughs in London as well as the Isles of Scilly (population: 2,100).
Now, let's plot the bottom 20 LAs by gender ratio.
=

Cool. Now let's find Cambridge... oh.
Uh oh.
Turns out, there are roughly 9 women aged 25-30 for 10 men aged 25-30 in Cambridge. But it gets worse. If we take the number of men aged 25-30 and subtract it from the number of women, we get this:
=
=
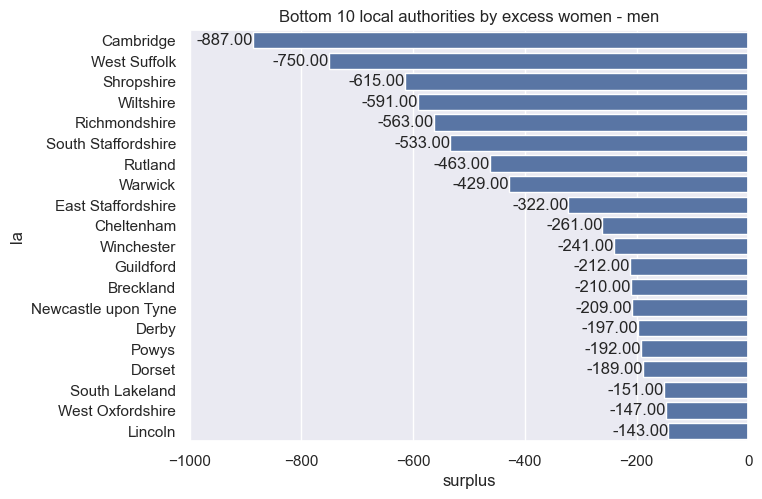
Yep, Cambridge is the worst area in the UK for dating, assuming you want to date women aged 25-30.
Plotting the data on a map
Let's plot this on a map, using this blog post as inspiration.
First, get the 2021 local authority boundaries from the Open Geography Portal. We're interested in the Shapefile format.
=
=
Make a nice Choropleth map of the gender ratios:
=
=
=
=
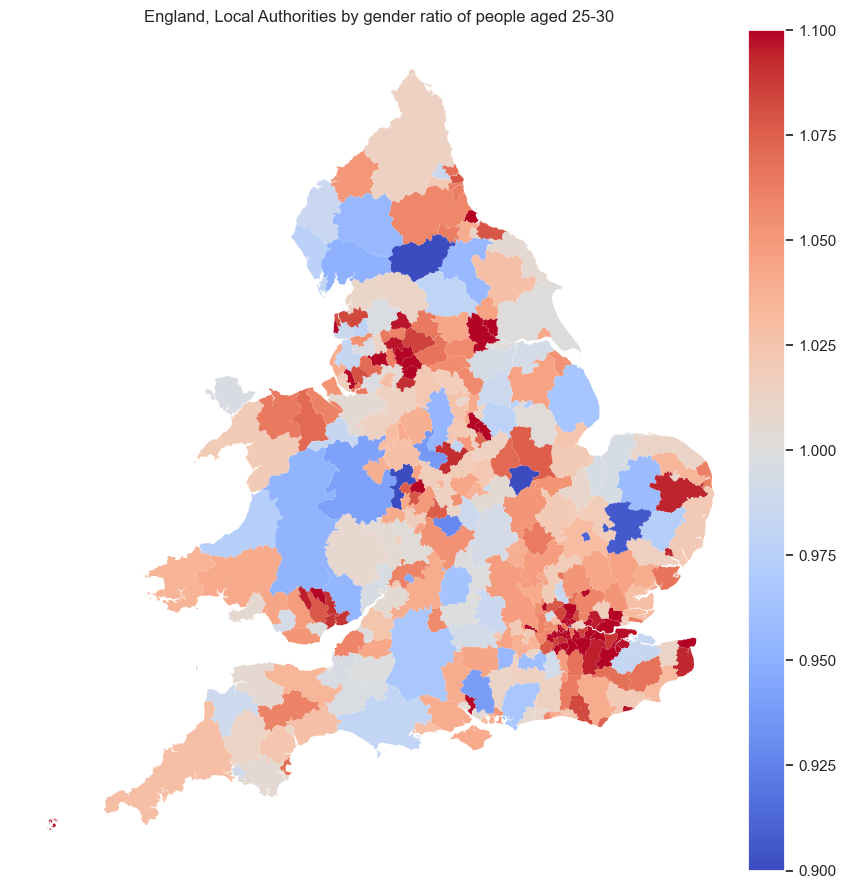
London is king here, just like we saw in the previous visualization.
Now, the map with the absolute difference between the number of women and men:
=
=
=
=
=

Not much is surprising here. The one red hot spot in the West Midlands is Birmingham.
Full table
Want to see how your local authority ranks? See the full table under the foldout:Click for full table
LAD21CD LAD21NM surplus female_to_male_ratio 1 E09000032 Wandsworth 4897 1.18918 2 E09000012 Hackney 3181 1.18008 3 E09000019 Islington 2786 1.17396 4 E09000022 Lambeth 2758 1.10796 5 E09000023 Lewisham 2737 1.17635 6 E08000025 Birmingham 2408 1.04944 7 E09000013 Hammersmith and Fulham 2269 1.17872 8 E09000008 Croydon 1905 1.11938 9 E09000014 Haringey 1764 1.12842 10 E09000007 Camden 1659 1.13485 11 E08000035 Leeds 1546 1.043 12 E09000028 Southwark 1545 1.06973 13 E09000006 Bromley 1432 1.13678 14 E09000020 Kensington and Chelsea 1398 1.19912 15 E09000010 Enfield 1383 1.11439 16 E09000003 Barnet 1380 1.08462 17 E08000032 Bradford 1308 1.06454 18 E09000011 Greenwich 1238 1.08544 19 E09000002 Barking and Dagenham 1228 1.14246 20 E08000030 Walsall 1217 1.11739 21 E08000001 Bolton 1125 1.10854 22 E09000031 Waltham Forest 1120 1.08304 23 E08000008 Tameside 1094 1.12678 24 E06000035 Medway 1048 1.09805 25 E08000028 Sandwell 1041 1.0786 26 E08000034 Kirklees 1037 1.06662 27 E06000018 Nottingham 1030 1.07295 28 E06000047 County Durham 1006 1.05824 29 E09000004 Bexley 991 1.11491 30 E09000009 Ealing 949 1.05579 31 E09000016 Havering 944 1.09585 32 E08000004 Oldham 927 1.10686 33 E08000007 Stockport 919 1.09179 34 E08000011 Knowsley 917 1.15187 35 E09000024 Merton 908 1.09063 36 E09000033 Westminster 900 1.06673 37 E06000034 Thurrock 892 1.13096 38 E08000010 Wigan 870 1.07076 39 E06000060 Buckinghamshire 867 1.04801 40 E08000005 Rochdale 824 1.10022 41 E08000036 Wakefield 808 1.05768 42 E09000026 Redbridge 775 1.06016 43 E08000031 Wolverhampton 760 1.07541 44 E09000029 Sutton 752 1.10341 45 E09000017 Hillingdon 744 1.06051 46 E09000018 Hounslow 737 1.05963 47 E07000066 Basildon 728 1.10203 48 E07000107 Dartford 725 1.15941 49 E06000061 North Northamptonshire 693 1.05227 50 E06000039 Slough 656 1.10567 51 E08000024 Sunderland 633 1.06293 52 E09000027 Richmond upon Thames 630 1.10879 53 E09000030 Tower Hamlets 599 1.02263 54 E08000033 Calderdale 597 1.08552 55 E07000114 Thanet 594 1.1328 56 W06000022 Newport 590 1.09044 57 E06000009 Blackpool 567 1.11406 58 E08000018 Rotherham 560 1.05725 59 E08000015 Wirral 560 1.05253 60 E07000073 Harlow 552 1.1498 61 E07000170 Ashfield 549 1.12178 62 E09000021 Kingston upon Thames 548 1.0856 63 E07000115 Tonbridge and Malling 545 1.13358 64 E08000013 St. Helens 544 1.08053 65 E07000202 Ipswich 538 1.09314 66 E08000029 Solihull 536 1.07603 67 E08000016 Barnsley 535 1.0559 68 E06000010 Kingston upon Hull, City of 531 1.04418 69 E06000030 Swindon 521 1.05739 70 E06000056 Central Bedfordshire 515 1.04785 71 E09000005 Brent 508 1.0292 72 E06000052 Cornwall 505 1.02938 73 E08000027 Dudley 501 1.04111 74 E08000022 North Tyneside 491 1.06802 75 E07000086 Eastleigh 486 1.09898 76 W06000018 Caerphilly 482 1.07695 77 E06000031 Peterborough 482 1.05274 78 E07000103 Watford 475 1.10603 79 E06000055 Bedford 449 1.06375 80 E08000019 Sheffield 440 1.01826 81 E06000042 Milton Keynes 439 1.03835 82 W06000016 Rhondda Cynon Taf 432 1.04917 83 E08000002 Bury 429 1.06224 84 E06000021 Stoke-on-Trent 421 1.04093 85 E06000033 Southend-on-Sea 412 1.06231 86 E06000058 Bournemouth, Christchurch and Poole 412 1.02876 87 E06000032 Luton 411 1.04203 88 E08000023 South Tyneside 401 1.07847 89 E07000149 South Norfolk 399 1.09402 90 E07000173 Gedling 398 1.09972 91 E08000012 Liverpool 389 1.01712 92 E06000024 North Somerset 383 1.05961 93 E06000016 Leicester 375 1.02311 94 E08000014 Sefton 372 1.04047 95 E07000039 South Derbyshire 371 1.09208 96 E07000108 Dover 354 1.09331 97 E07000070 Chelmsford 353 1.05163 98 E06000014 York 346 1.04535 99 E07000109 Gravesham 346 1.08975 100 E06000044 Portsmouth 346 1.038 101 E06000003 Redcar and Cleveland 345 1.07886 102 E06000001 Hartlepool 343 1.10807 103 E07000141 South Kesteven 330 1.07533 104 W06000005 Flintshire 320 1.06025 105 E07000105 Ashford 319 1.0679 106 E07000169 Selby 318 1.10166 107 E07000111 Sevenoaks 315 1.09497 108 E07000084 Basingstoke and Deane 315 1.04424 109 E07000122 Pendle 313 1.0961 110 W06000020 Torfaen 313 1.09217 111 E06000043 Brighton and Hove 303 1.02425 112 E07000062 Hastings 301 1.09682 113 E07000071 Colchester 301 1.04017 114 E09000025 Newham 301 1.01393 115 E06000006 Halton 300 1.06409 116 E06000012 North East Lincolnshire 298 1.05369 117 E07000228 Mid Sussex 290 1.06368 118 E06000025 South Gloucestershire 289 1.02495 119 E07000219 Nuneaton and Bedworth 288 1.05484 120 E06000022 Bath and North East Somerset 285 1.0422 121 E07000076 Tendring 284 1.06717 122 E06000027 Torbay 284 1.06744 123 E07000098 Hertsmere 280 1.07761 124 E06000004 Stockton-on-Tees 279 1.03908 125 E07000207 Elmbridge 275 1.07694 126 E06000020 Telford and Wrekin 272 1.03853 127 E07000242 East Hertfordshire 271 1.05169 128 E07000208 Epsom and Ewell 270 1.11578 129 E07000128 Wyre 269 1.08417 130 E07000072 Epping Forest 265 1.05882 131 E07000226 Crawley 263 1.0507 132 W06000019 Blaenau Gwent 258 1.10106 133 E06000041 Wokingham 251 1.04518 134 E07000067 Braintree 249 1.04585 135 E07000243 Stevenage 248 1.06672 136 E07000211 Reigate and Banstead 244 1.04825 137 E07000095 Broxbourne 244 1.06793 138 W06000010 Carmarthenshire 243 1.04103 139 E07000061 Eastbourne 243 1.07364 140 E07000116 Tunbridge Wells 241 1.06802 141 E06000005 Darlington 236 1.06191 142 E07000125 Rossendale 232 1.09663 143 E07000096 Dacorum 225 1.04108 144 E07000117 Burnley 222 1.06047 145 E08000009 Trafford 222 1.02917 146 W06000012 Neath Port Talbot 220 1.04431 147 W06000014 Vale of Glamorgan 217 1.05157 148 E07000229 Worthing 216 1.05788 149 E07000221 Stratford-on-Avon 215 1.05388 150 W06000003 Conwy 214 1.06463 151 E07000063 Lewes 212 1.0832 152 W06000004 Denbighshire 212 1.07169 153 E06000038 Reading 211 1.02415 154 E07000213 Spelthorne 210 1.05814 155 E07000090 Havant 210 1.05204 156 E07000028 Carlisle 206 1.05121 157 E07000145 Great Yarmouth 206 1.06151 158 E07000036 Erewash 205 1.04953 159 W06000024 Merthyr Tydfil 204 1.09475 160 E07000120 Hyndburn 202 1.06415 161 E07000126 South Ribble 201 1.05437 162 E07000083 Tewkesbury 191 1.06052 163 E06000036 Bracknell Forest 189 1.03874 164 E07000091 New Forest 187 1.04041 165 E07000192 Cannock Chase 182 1.04542 166 E06000049 Cheshire East 178 1.01339 167 E07000093 Test Valley 177 1.04012 168 E07000065 Wealden 177 1.04017 169 E07000246 Somerset West and Taunton 176 1.03482 170 E08000003 Manchester 175 1.00558 171 E08000026 Coventry 172 1.01175 172 E07000132 Hinckley and Bosworth 172 1.0434 173 E06000046 Isle of Wight 165 1.04119 174 E08000037 Gateshead 164 1.02156 175 E07000215 Tandridge 162 1.0673 176 E07000102 Three Rivers 159 1.05546 177 E07000012 South Cambridgeshire 157 1.03097 178 E07000236 Redditch 155 1.04506 179 E07000130 Charnwood 153 1.02313 180 E07000244 East Suffolk 151 1.02125 181 E07000042 Mid Devon 147 1.06079 182 E07000129 Blaby 137 1.03747 183 E07000144 Broadland 134 1.03471 184 W06000009 Pembrokeshire 133 1.03533 185 E07000011 Huntingdonshire 133 1.02065 186 E07000239 Wyre Forest 132 1.04068 187 E07000142 West Lindsey 132 1.04607 188 E07000197 Stafford 130 1.02769 189 E07000033 Bolsover 130 1.04124 190 E06000057 Northumberland 128 1.01337 191 E07000195 Newcastle-under-Lyme 123 1.02986 192 E07000081 Gloucester 122 1.02281 193 E07000040 East Devon 115 1.02796 194 E07000077 Uttlesford 115 1.04374 195 E07000212 Runnymede 112 1.03741 196 E07000214 Surrey Heath 111 1.03795 197 E07000133 Melton 111 1.07166 198 E07000112 Folkestone and Hythe 110 1.03168 199 E07000199 Tamworth 107 1.03477 200 E07000198 Staffordshire Moorlands 106 1.03852 201 E06000040 Windsor and Maidenhead 104 1.02142 202 E07000032 Amber Valley 97 1.02221 203 E07000079 Cotswold 97 1.04057 204 E07000045 Teignbridge 94 1.02421 205 E07000240 St Albans 90 1.02009 206 E07000038 North East Derbyshire 89 1.02656 207 E07000099 North Hertfordshire 87 1.01885 208 E07000088 Gosport 84 1.0288 209 E07000075 Rochford 84 1.03157 210 E06000008 Blackburn with Darwen 80 1.01322 211 W06000002 Gwynedd 78 1.01995 212 E07000223 Adur 77 1.04113 213 E07000134 North West Leicestershire 76 1.01997 214 E07000237 Worcester 73 1.01693 215 E07000172 Broxtowe 73 1.01703 216 E06000002 Middlesbrough 71 1.01157 217 E06000050 Cheshire West and Chester 70 1.00543 218 E07000227 Horsham 69 1.01511 219 E07000140 South Holland 67 1.02114 220 E06000045 Southampton 67 1.0054 221 E07000092 Rushmoor 66 1.01413 222 E07000037 High Peak 66 1.02253 223 E07000136 Boston 65 1.0254 224 E07000106 Canterbury 65 1.01269 225 E07000148 Norwich 64 1.00887 226 E07000194 Lichfield 64 1.01792 227 E07000174 Mansfield 63 1.01446 228 E08000006 Salford 62 1.00393 229 E07000074 Maldon 58 1.02903 230 E07000041 Exeter 57 1.01067 231 E07000069 Castle Point 57 1.01981 232 W06000011 Swansea 55 1.00635 233 E07000009 East Cambridgeshire 54 1.01904 234 E07000176 Rushcliffe 52 1.01399 235 E07000121 Lancaster 52 1.01088 236 E07000216 Waverley 52 1.01589 237 E07000234 Bromsgrove 51 1.0173 238 E07000068 Brentwood 50 1.01739 239 E07000064 Rother 48 1.02055 240 E07000217 Woking 48 1.01238 241 E06000019 Herefordshire, County of 46 1.00785 242 E07000085 East Hampshire 45 1.01201 243 E07000167 Ryedale 43 1.02799 244 E07000200 Babergh 42 1.0161 245 E07000224 Arun 41 1.00801 246 E07000034 Chesterfield 37 1.00941 247 E07000010 Fenland 34 1.00908 248 E07000218 North Warwickshire 32 1.01405 249 E07000147 North Norfolk 29 1.01116 250 E07000178 Oxford 28 1.00308 251 E07000168 Scarborough 20 1.00598 252 E07000087 Fareham 20 1.00592 253 E07000043 North Devon 20 1.00653 254 E07000047 West Devon 19 1.01291 255 E06000053 Isles of Scilly 19 1.34545 256 E07000082 Stroud 19 1.00515 257 E07000163 Craven 18 1.01164 258 E07000131 Harborough 15 1.0049 259 E06000011 East Riding of Yorkshire 15 1.00147 260 E07000044 South Hams 14 1.0062 261 E06000023 Bristol, City of 14 1.00052 262 E07000139 North Kesteven 11 1.00272 263 E07000235 Malvern Hills 10 1.00478 264 E07000238 Wychavon 8 1.00194 265 E07000177 Cherwell 4 1.00061 266 E07000187 Mendip -2 0.999422 267 E07000180 Vale of White Horse -4 0.99922 268 E07000124 Ribble Valley -5 0.997166 269 W06000001 Isle of Anglesey -7 0.996562 270 W06000015 Cardiff -8 0.999542 271 E07000080 Forest of Dean -12 0.995557 272 E07000118 Chorley -14 0.996547 273 E07000189 South Somerset -15 0.997371 274 E07000188 Sedgemoor -15 0.996459 275 E07000210 Mole Valley -21 0.991418 276 E07000046 Torridge -22 0.988415 277 E07000135 Oadby and Wigston -24 0.987603 278 E07000146 King's Lynn and West Norfolk -28 0.994652 279 E06000007 Warrington -28 0.996355 280 E07000119 Fylde -31 0.98669 281 W06000013 Bridgend -35 0.993511 282 E06000037 West Berkshire -38 0.992822 283 E06000013 North Lincolnshire -42 0.992889 284 E07000026 Allerdale -45 0.985773 285 E07000027 Barrow-in-Furness -52 0.980662 286 E07000029 Copeland -54 0.976744 287 E07000171 Bassetlaw -54 0.987285 288 E09000015 Harrow -57 0.99491 289 W06000008 Ceredigion -58 0.97366 290 E07000220 Rugby -59 0.986792 291 E07000127 West Lancashire -63 0.982815 292 E08000017 Doncaster -70 0.994336 293 E07000030 Eden -72 0.955473 294 E07000241 Welwyn Hatfield -72 0.984752 295 E07000179 South Oxfordshire -75 0.985386 296 W06000006 Wrexham -80 0.98361 297 E07000035 Derbyshire Dales -83 0.954768 298 E07000203 Mid Suffolk -88 0.973708 299 E07000113 Swale -93 0.983929 300 E07000165 Harrogate -96 0.980332 301 E07000175 Newark and Sherwood -100 0.977381 302 E06000062 West Northamptonshire -106 0.993675 303 E07000110 Maidstone -116 0.98311 304 E07000164 Hambleton -118 0.956919 305 E06000026 Plymouth -118 0.989169 306 E09000001 City of London -120 0.847909 307 W06000021 Monmouthshire -127 0.954643 308 E07000225 Chichester -128 0.966483 309 E07000123 Preston -137 0.979488 310 E07000137 East Lindsey -140 0.965466 311 E07000138 Lincoln -143 0.970357 312 E07000089 Hart -143 0.955618 313 E07000181 West Oxfordshire -147 0.964006 314 E07000031 South Lakeland -151 0.951085 315 E06000059 Dorset -189 0.981636 316 W06000023 Powys -192 0.952721 317 E06000015 Derby -197 0.982535 318 E08000021 Newcastle upon Tyne -209 0.985025 319 E07000143 Breckland -210 0.958234 320 E07000209 Guildford -212 0.959465 321 E07000094 Winchester -241 0.939172 322 E07000078 Cheltenham -261 0.948358 323 E07000193 East Staffordshire -322 0.937073 324 E07000222 Warwick -429 0.928832 325 E06000017 Rutland -463 0.696393 326 E07000196 South Staffordshire -533 0.861089 327 E07000166 Richmondshire -563 0.73088 328 E06000054 Wiltshire -591 0.966601 329 E06000051 Shropshire -615 0.94186 330 E07000245 West Suffolk -750 0.906716 331 E07000008 Cambridge -887 0.912378
Conclusion
There's a bunch of other data that's collected by the Census and existing visualizers are mostly about visualizing single variables on a map. Perhaps it would be cool to build something like what I did, but interactive, with filters and dynamic expressions. Or a different visualization method, like the demographic pyramid in a certain area.
But maybe later. I suddenly feel a weird urge to go to the gym or move out.